rossby_radius documentation
rossby_radius computes the Rossby radius of deformation for a barotropic ocean,

where  is the Rossby radius of deformation,
  is gravitational acceleration,
  is the water depth, and
  is the Coriolis parameter given by coriolisf.
Back to Climate Data Tools Contents.
Contents
Syntax
Lr = rossby_radius(lat,lon)
Lr = rossby_radius(lat,'depth',D)
Lr = rossby_radius(...,'rot',rot)
Lr = rossby_radius(...,'g',gravity)
Description
Lr = rossby_radius(lat,lon) computes the barotropic Rossby radius of deformation in the ocean at the geo coordinates lat,lon. The Rossby radius calculation depends on ocean depth, which is automatically determined via the topo_interp function.
Lr = rossby_radius(lat,'depth',D) overrides automatic calculation of ocean depth by entering depths D, which can be scalar or the same size as lat. Depths should be positive.
Lr = rossby_radius(...,'rot',rot) specifies a rate of rotation. By default, rot is Earth's present-day rate of rotation 7.2921 x 10^-5 rad/s, but a different rate may be specified to model Earth at a different time, other celestial bodies.
Lr = rossby_radius(...,'g',gravity) specifies the gravitational rate of acceleration. Default is value is 9.81.
Example: Global ocean
Get the Barotropic Rossby radius everywhere in Earth's oceans. Start by making a quarter-degree grid that covers the world with cdtgrid, then calculate the Rossby radius for each grid point:
[lat,lon] = cdtgrid(0.25);

r = rossby_radius(lat,lon);

% Plot it up:
imagescn(lon,lat,r)

% Set color axis properties:
set(gca,'colorscale','log')
%caxis([1e5 1e7]) % sets color axis limits
cb = colorbar;
ylabel(cb,'Rossby radius (m)')
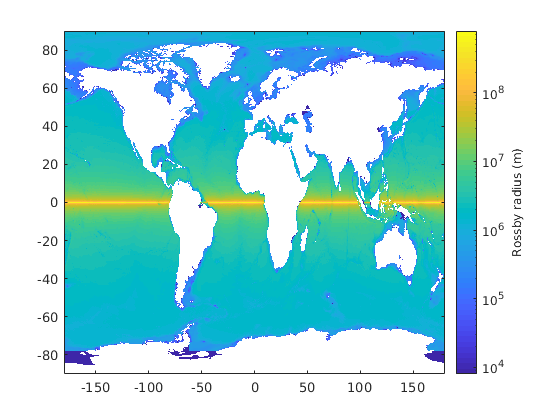
What we see is the Rossby radius is small near the poles and in shallow waters anywhere. In the deep equatorial waters, the Rossby radius is quite large!
Make it strange by changing the colormap to the cmocean tempo colormap and underlay with an earthimage:
cmocean tempo

hold on
h = earthimage;
uistack(h,'bottom') % puts Earth image underneath Rossby radius

Author Info
This function is part of the Climate Data Toolbox for Matlab. The function and supporting documentation were written by Chad A. Greene of the University of Texas at Austin.